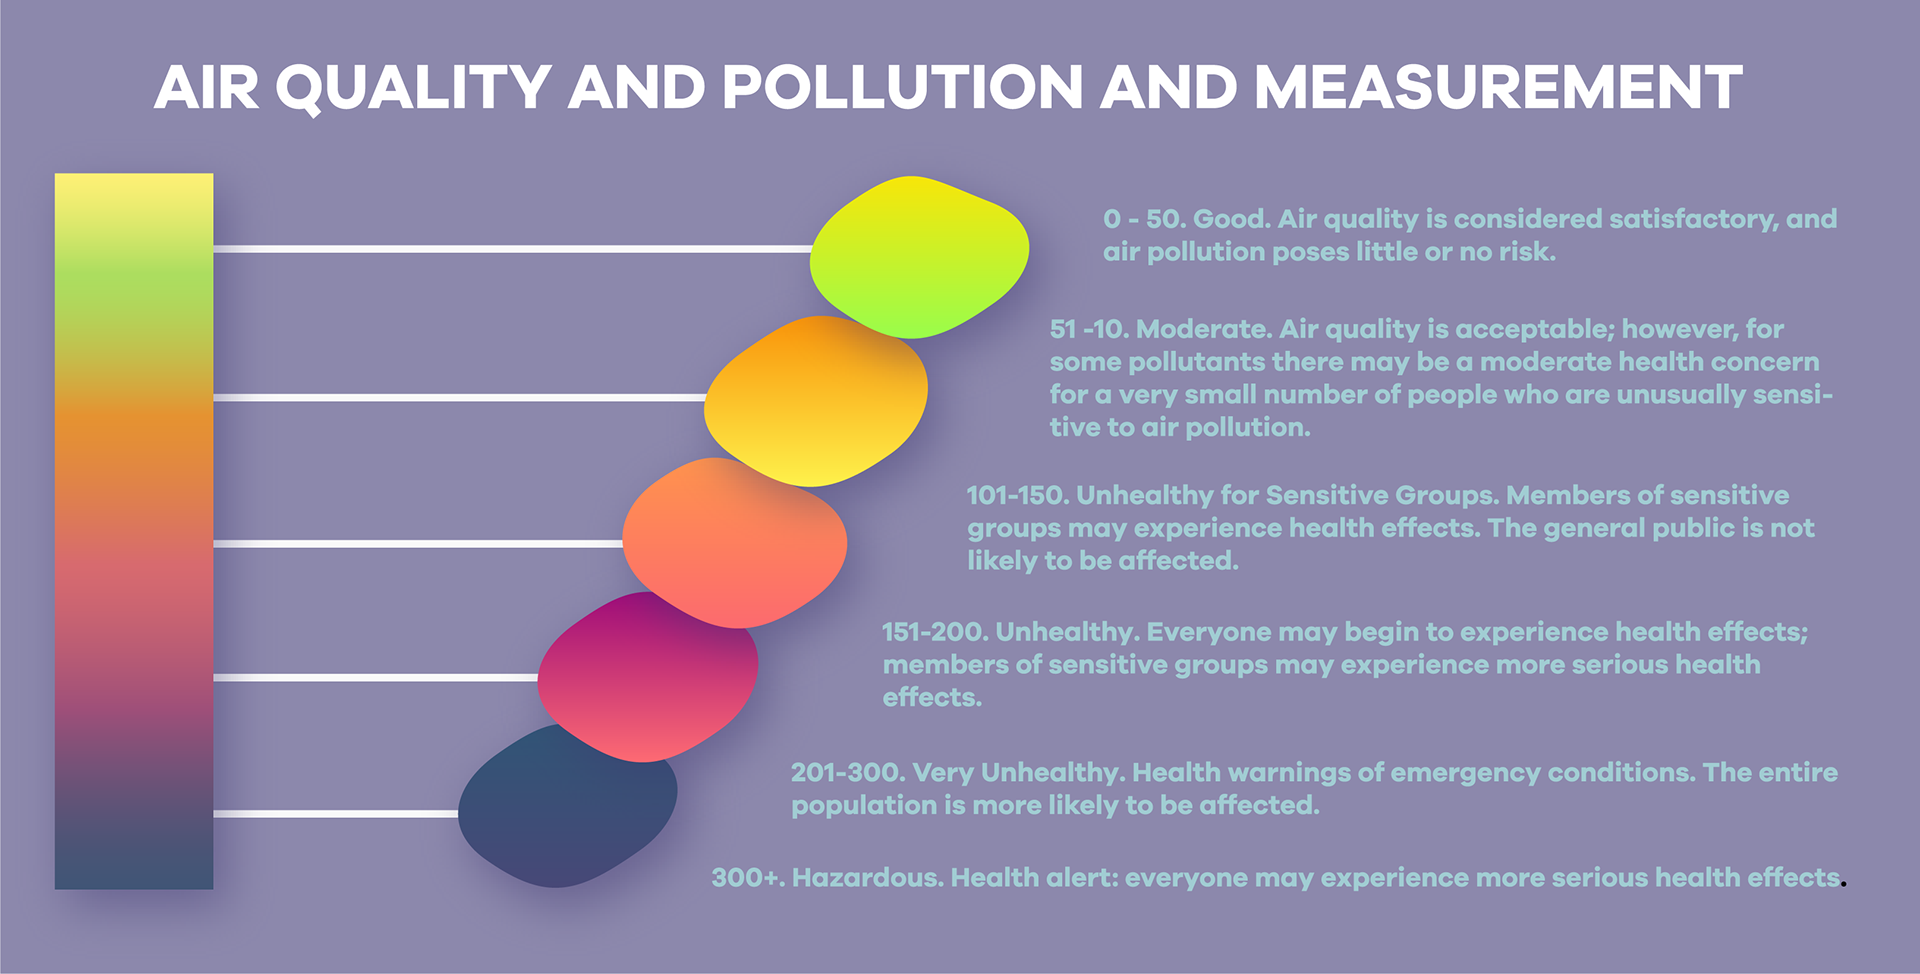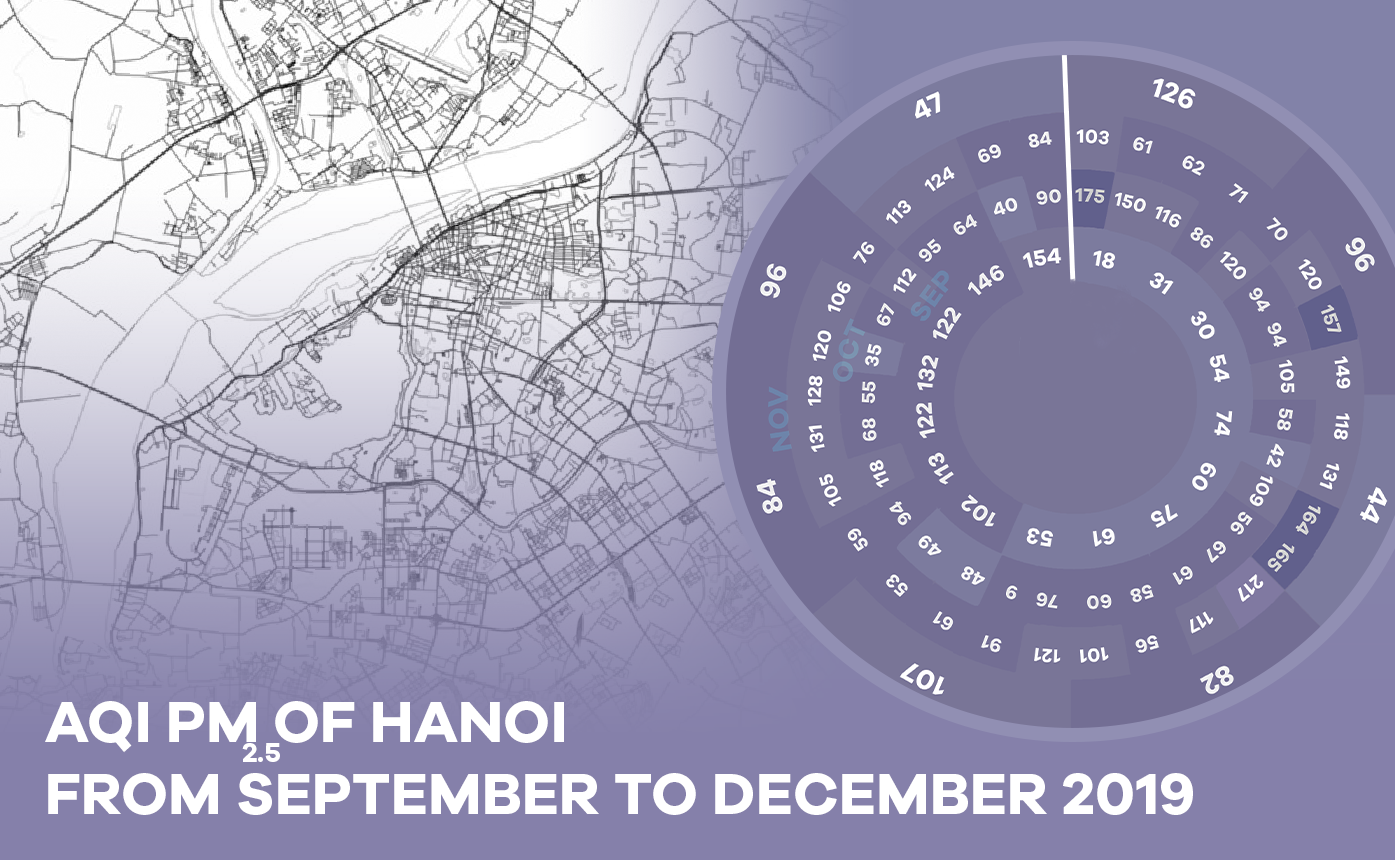

THESE ARE MY Infographics for my web design course, where i focus on translating information and numbers into simplistic illustrations. I chose to work on the air quality report of my city, hanoi.
I color coded the air quality depended on the number my resource website provided and made a circle calendar on the data of each day it reported, from September to December of 2019.
it is alarming to see air quality of big cities are so damaging, and some are inhabitable. from this project i hope i can raise awareness for air quality control big cities.


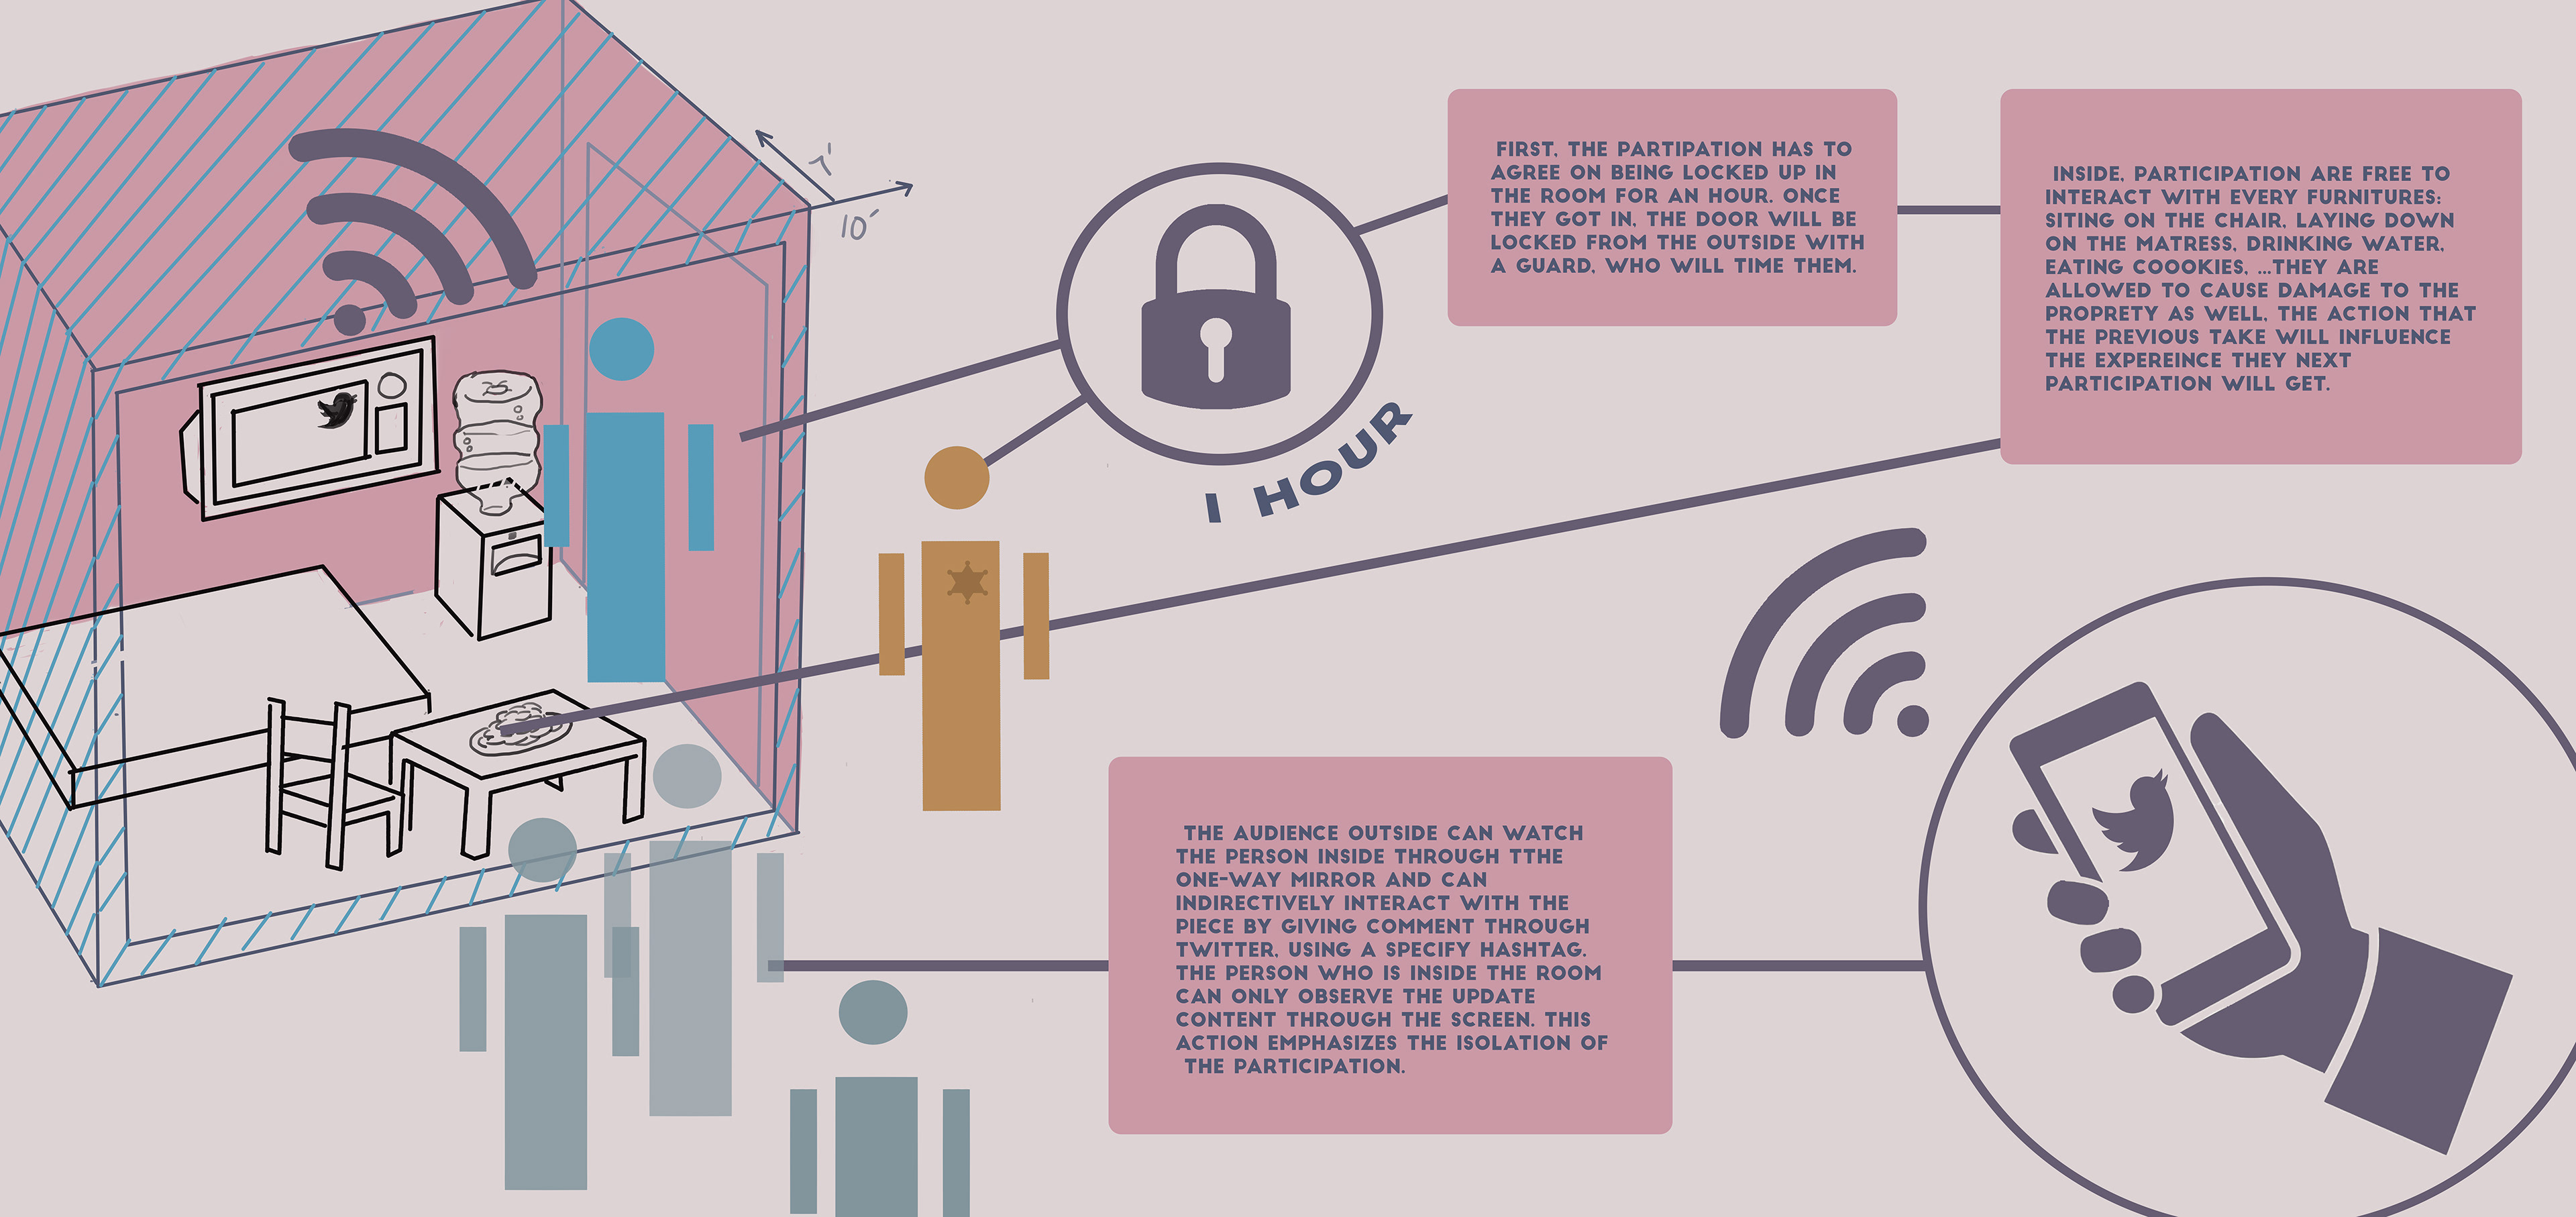
In my interactive art course, I was asked to design an interactive piece based on on of the existing pieces.
Here is my influence from the piece "Kidnap" by blast theory, where volunteer is locked in a room and audience can watched them through a one-way mirror. They can only interact with the volunteer through a twitter feed, however volunteer can not responded. The theme for this project is surveillance and lacking control.
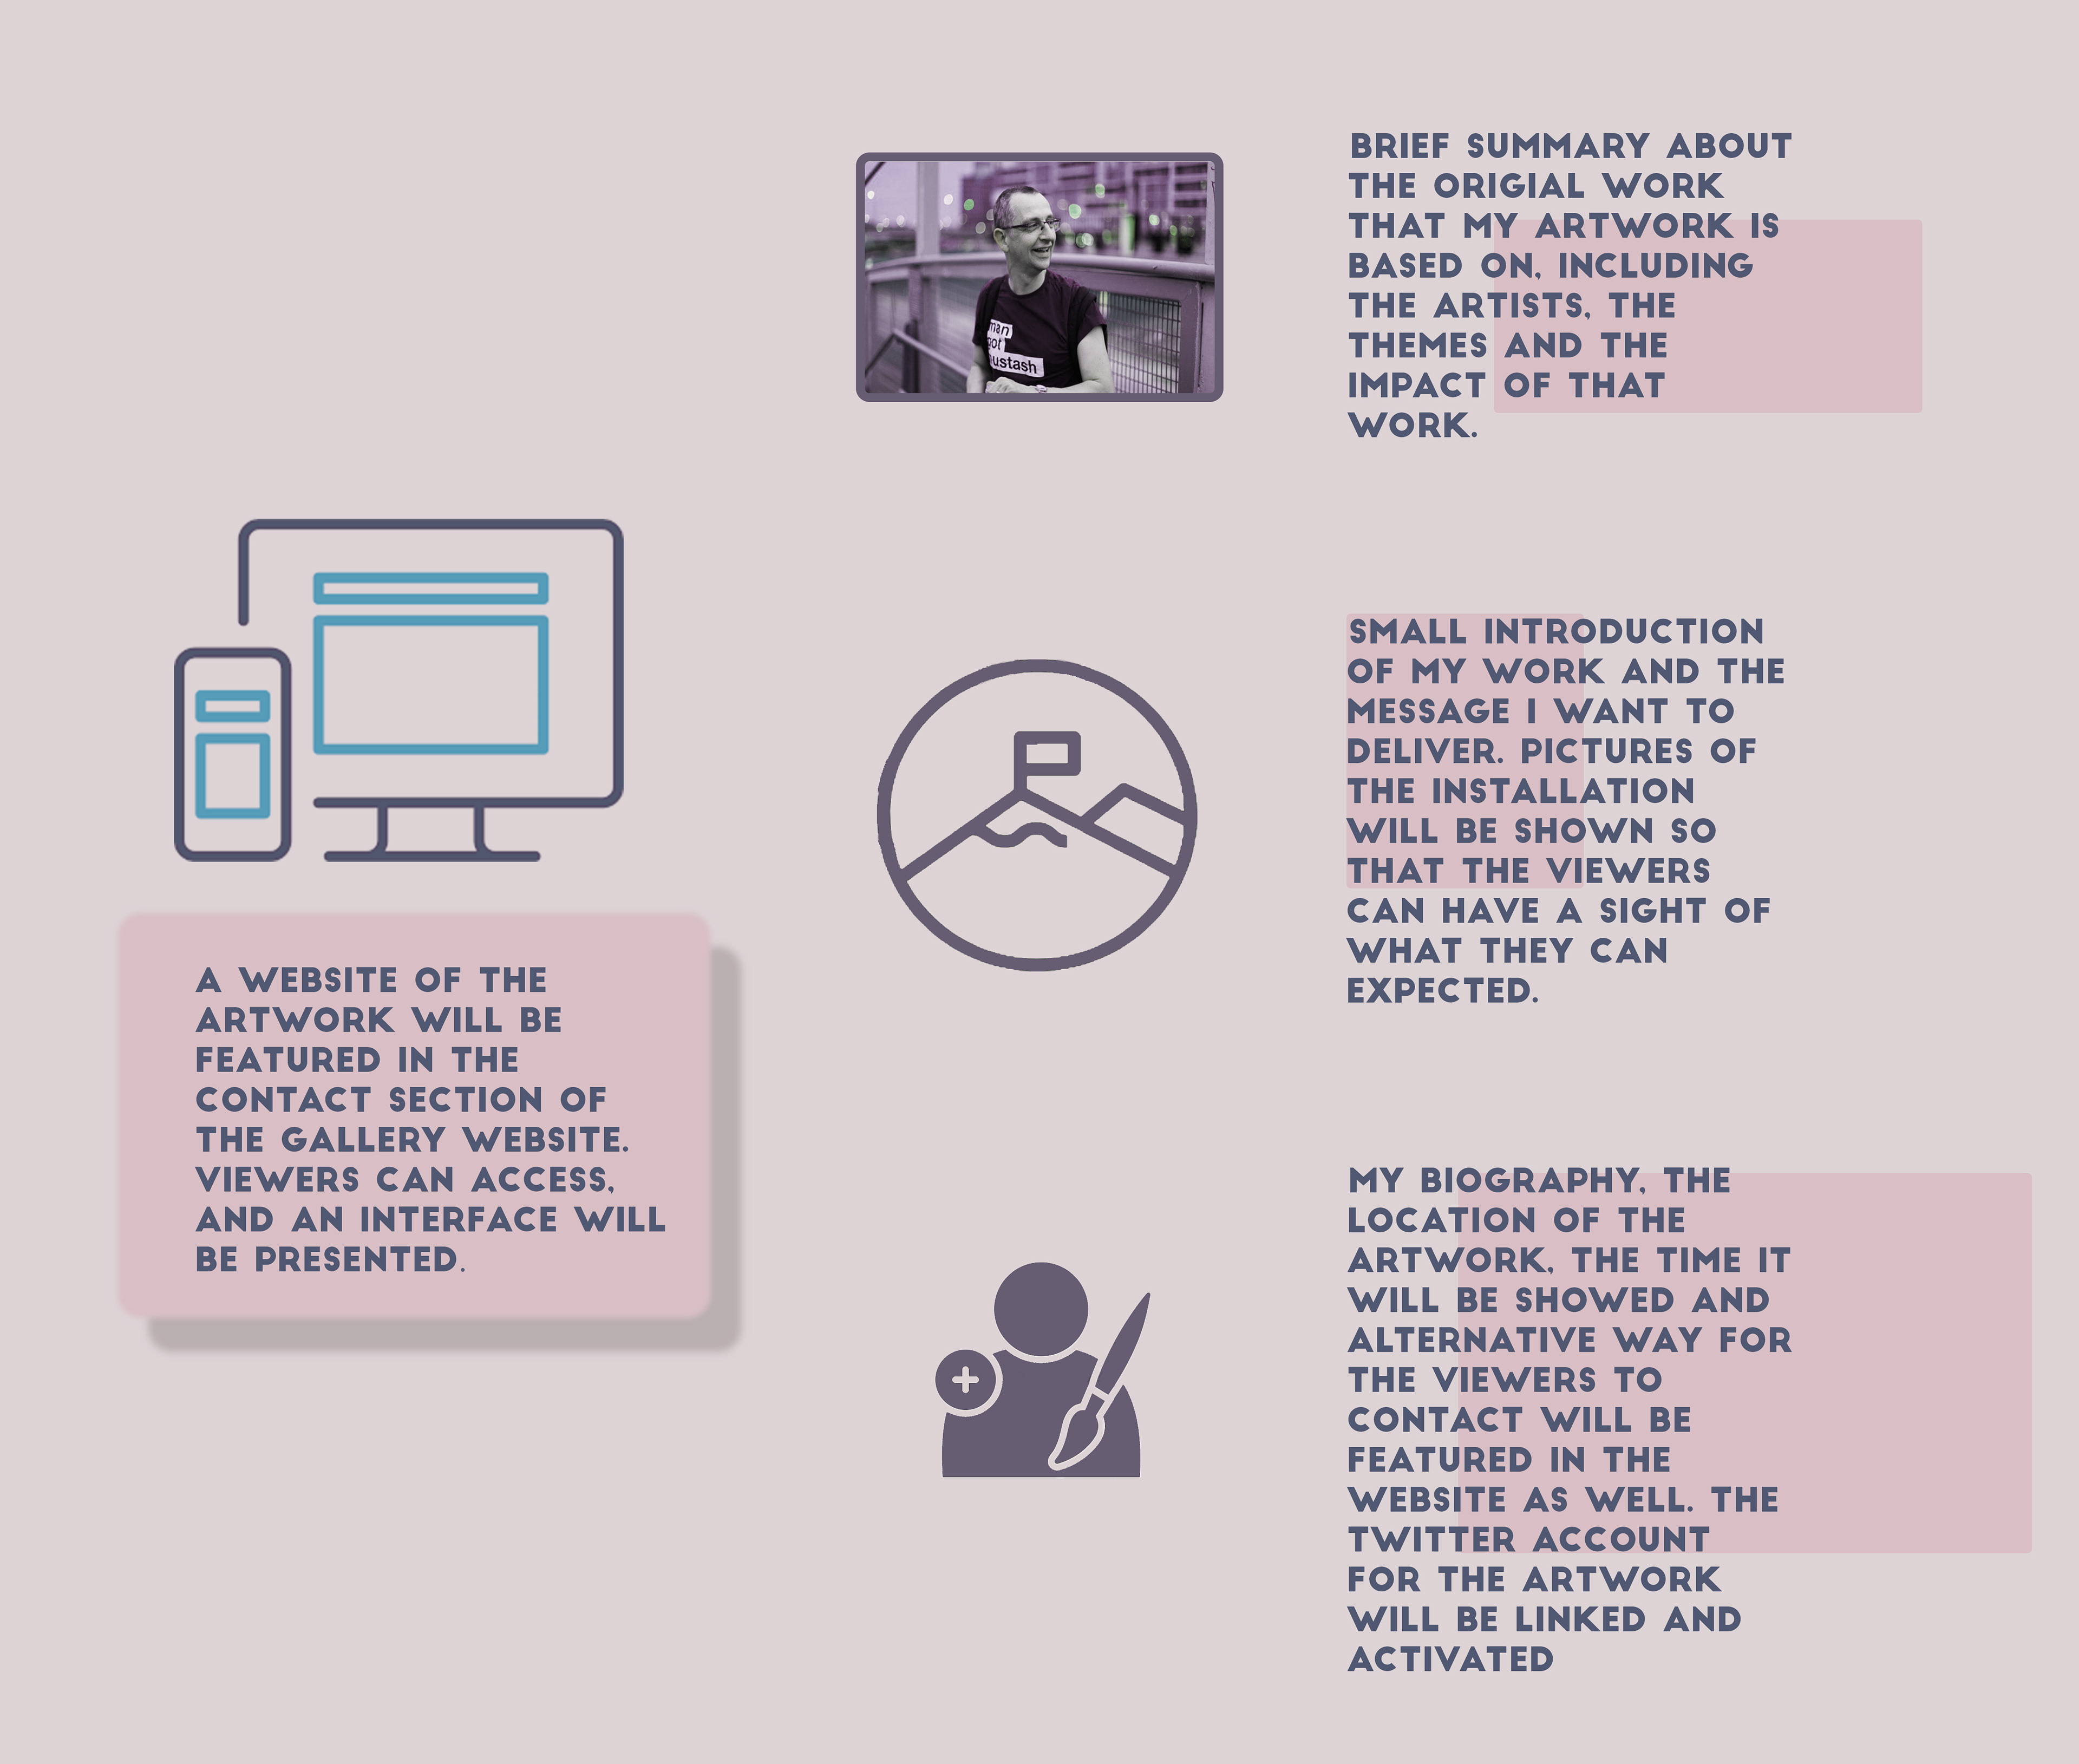
to make it more interactive, i made a plan to promote it via social media and a website featured all the information in needed. This included the live twitter thread once the piece is in action.